Documentation Index
Fetch the complete documentation index at: https://docs.synthefy.com/llms.txt
Use this file to discover all available pages before exploring further.
Anomaly Detection
Problem: Infrastructure monitoring generates massive amounts of time series data (CPU, memory, network metrics). Traditional anomaly detection methods like Z-scores or Prophet only look at statistical deviations, missing contextual patterns and relationships between metrics. This can lead to high false positive rates or missed anomalies. Our approach: We use forecast-error based anomaly detection with Synthefy’s forecasting API. By predicting expected values using historical patterns, we flag points with large forecast errors as anomalies. We compare three Synthefy configurations to demonstrate the impact of multivariate context and leak columns:- Univariate: Only the target column (no metadata) - baseline Synthefy performance
- Multivariate: Target + metadata columns (memory, network) - learns cross-metric patterns
- Multivariate + Leak: Target + metadata with future values provided - best possible anomaly detection scenario
Prerequisites
First, install the required libraries:pip install synthefy matplotlib numpy pandas prophet scikit-learn
1. Load and Configure Data
We’ll use a multivariate time series dataset with 15-minute interval server metrics including CPU, memory, and network usage.import logging
import os
import matplotlib.pyplot as plt
import numpy as np
import pandas as pd
from prophet import Prophet
from sklearn.metrics import (
f1_score,
precision_score,
recall_score,
roc_auc_score,
)
from swarm_visualizer.utility.general_utils import set_plot_properties
from synthefy import SynthefyAPIClient
# Set plot properties for consistent styling
set_plot_properties(usetex=False)
# Set up API key
os.environ["SYNTHEFY_API_KEY"] = os.getenv("SYNTHEFY_API_KEY", "")
# Plot colors - consistent with other Synthefy demos
COLORS = {
"synthefy_univariate": "#2563eb", # Blue
"synthefy_multivariate": "#16a34a", # Green
"synthefy_multivariate_leak": "#fea333", # Orange
"prophet": "#7c3aed", # Purple
"zscore": "#94a3b8", # Gray
"groundtruth": "black",
"anomaly": "#dc2626", # Red
}
# Configuration
FORECAST_DAYS = 1 # Forecast last day
INTERVALS_PER_HOUR = 4 # 15-minute intervals per hour
TOTAL_FORECAST_INTERVALS = int(FORECAST_DAYS * 24 * INTERVALS_PER_HOUR) # 96 intervals
BATCH_SIZE = 1 # Number of forecasts per API call
ANOMALY_PERCENTILE = 90 # Top 10% of errors flagged as anomalies (fallback if not optimizing)
OPTIMIZE_METRIC = "f1" # Optimize threshold for: "f1", "precision", "recall", or None for fixed percentile
CLEAN_MODE = "interpolate" # How to handle anomalies in history
# Target and metadata configuration
TARGET_COL = "cpu_percent" # Column to detect anomalies in
METADATA_COLS = [
"memory_percent",
"network_mbps",
]
# Models to run (set to False to skip)
RUN_MODELS = {
"synthefy_univariate": True, # Synthefy with only target column
"synthefy_multivariate": True, # Synthefy with metadata columns (no leak)
"synthefy_multivariate_leak": True, # Synthefy with metadata + leak columns
"prophet": True, # Facebook Prophet (univariate baseline)
"zscore": True, # Z-score statistical baseline
}
SYNTHEFY_MODEL = "Migas-1.0"
# Load data from Google Drive
data_link = (
"https://drive.google.com/uc?export=download&id=1wys6MdTyRtWsiFGGsGo7sH3tvBBXoOQZ"
)
df = pd.read_csv(data_link)
df["timestamp"] = pd.to_datetime(df["timestamp"])
print(f"Data shape: {df.shape}")
print(f"Date range: {df['timestamp'].min()} to {df['timestamp'].max()}")
print(f"Anomaly rate: {df['is_anomaly'].mean():.2%}")
print(f"Models to run: {[k for k, v in RUN_MODELS.items() if v]}")
2. Visualize the Data
Before running anomaly detection, let’s visualize the multivariate time series to understand the data patterns to see the signals and what anomalies look like.Show plotting code for raw data visualization
Show plotting code for raw data visualization
# Calculate split point (where forecasting begins)
split_idx = int(len(df) - TOTAL_FORECAST_INTERVALS)
forecast_start_ts = df.iloc[split_idx]["timestamp"]

fig, axes = plt.subplots(3, 1, figsize=(25, 16), sharex=True)

features = [
    ("cpu_percent", "CPU (%)", "#2563eb"),
    ("memory_percent", "Memory (%)", "#16a34a"),
    ("network_mbps", "Network (MB/s)", "#ea580c"),
]

for ax, (col, label, color) in zip(axes, features):
    ax.plot(df["timestamp"], df[col], color=color, alpha=0.8, linewidth=1.2)

    # Highlight anomaly regions with red background
    anom_mask = df["is_anomaly"] == 1
    anom_indices = df.index[anom_mask].tolist()

    # Group consecutive anomaly indices into regions
    if anom_indices:
        regions = []
        start = anom_indices[0]
        end = anom_indices[0]
        for idx in anom_indices[1:]:
            if idx == end + 1:
                end = idx
            else:
                regions.append((start, end))
                start = idx
                end = idx
        regions.append((start, end))

        # Draw red regions
        for start_idx, end_idx in regions:
            ax.axvspan(
                df.loc[start_idx, "timestamp"],
                df.loc[end_idx, "timestamp"],
                color=COLORS["anomaly"],
                alpha=0.2,
                label="Anomaly" if start_idx == regions[0][0] else None,
            )

    # Add vertical line at forecast start (only on first subplot for legend)
    if ax == axes[0]:
        ax.axvline(
            forecast_start_ts,
            color=COLORS["groundtruth"],
            linestyle="--",
            linewidth=2,
            alpha=0.7,
            label="Forecast Start",
        )
    else:
        ax.axvline(
            forecast_start_ts,
            color=COLORS["groundtruth"],
            linestyle="--",
            linewidth=2,
            alpha=0.7,
        )

    ax.set_ylabel(label)
    ax.grid(True, alpha=0.3, linestyle="--")

    # Add day separators (every day) - 96 intervals per day
    dates = df["timestamp"].values
    for i in range(1, 14):
        if i * 96 < len(dates):
            ax.axvline(dates[i * 96], color="gray", alpha=0.2, linestyle=":")

axes[0].set_title(
    "Multivariate Anomaly Detection Dataset\n2 Weeks of Server Monitoring (15-Minute Intervals)",
    fontweight="bold",
)
axes[0].legend(loc="upper left")
axes[-1].set_xlabel("Time")

plt.tight_layout()
plt.savefig("anomaly_detection/multivariate_anomaly_visualization.png", dpi=150, bbox_inches="tight")
plt.show()
Example Output: Raw Data with Anomalies
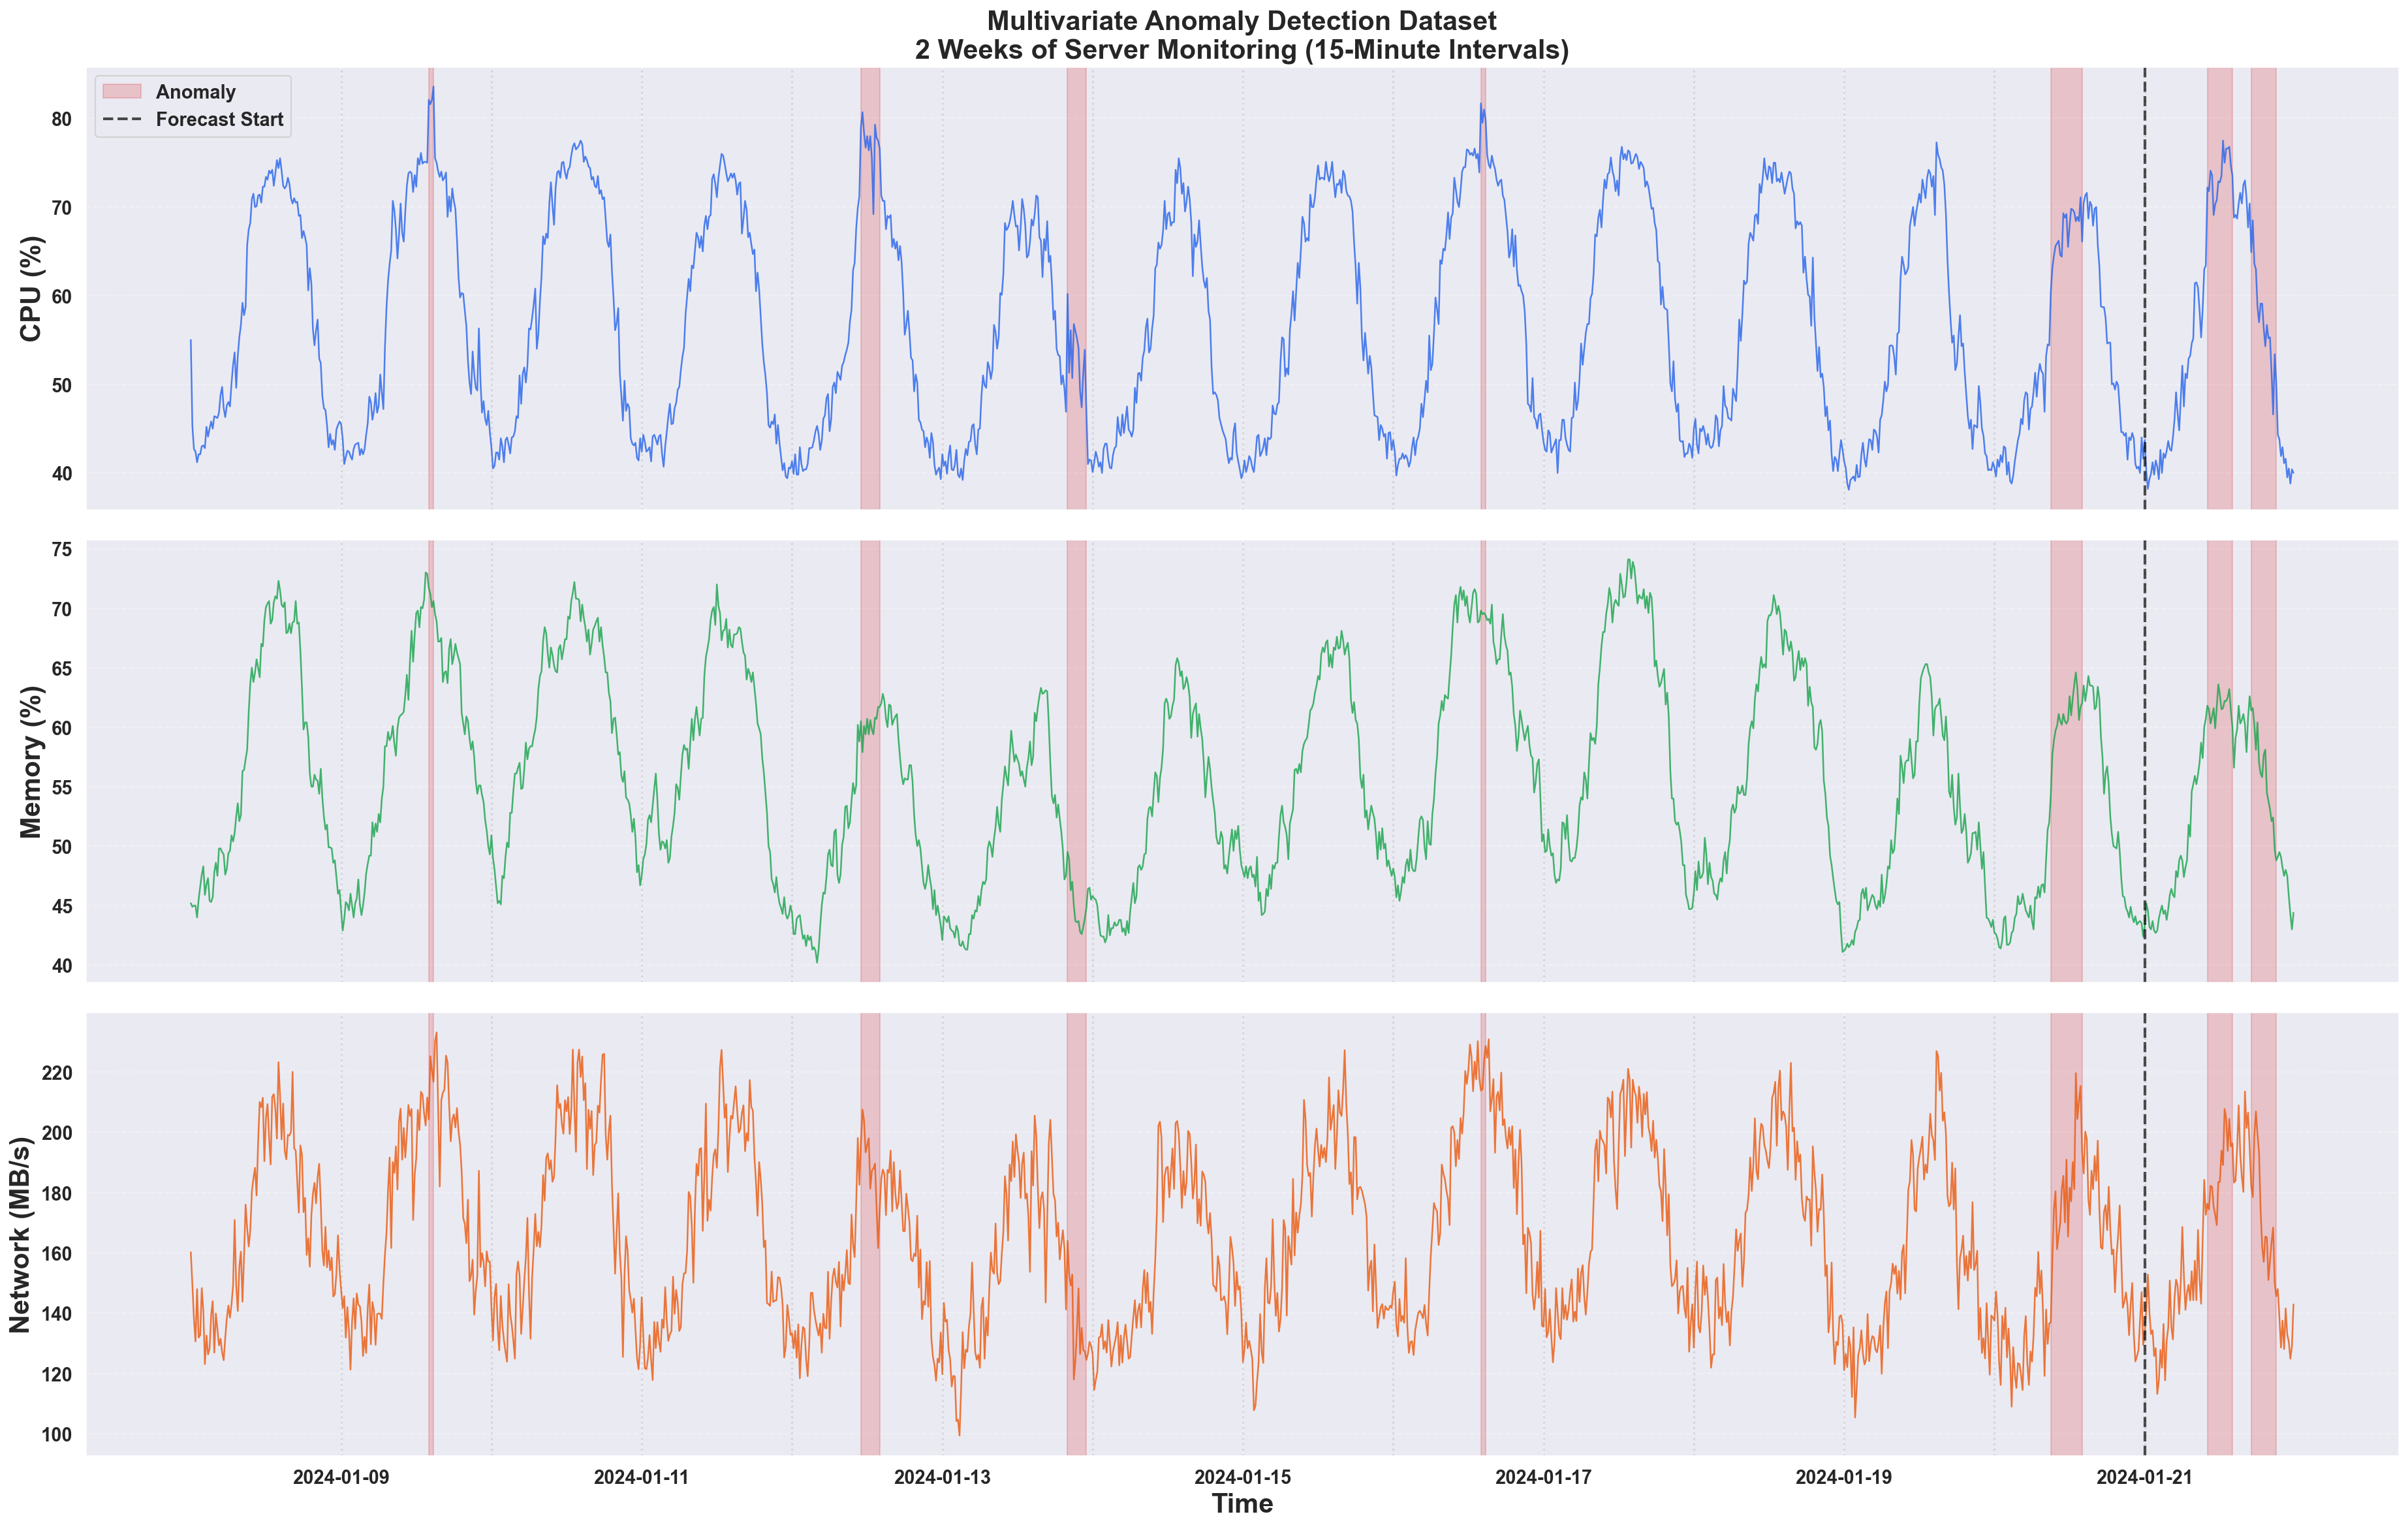
- Some anomalies are obvious spikes (easy to detect)
- Others are subtle deviations that only make sense when considering the other metrics
- The metrics are correlated
Key Challenge: The subtle anomalies in the last 2 days are where multivariate detection shines. These anomalies represent cases where CPU behaves unexpectedly given the other metrics - something univariate methods cannot detect.
3. Clean History Data
Before forecasting, we will handle known anomalies in the training data to prevent the model from learning anomalous patterns.⚡ Tip: You can experiment with your own anomaly-cleaning techniques or preprocessing strategies here—choose a method that best fits your domain knowledge and business requirements!
def clean_history(df, target_col, metadata_cols, mode="drop"):
    """
    Clean history data by handling anomalous points.

    Parameters
    ----------
    df : DataFrame
        Input data with 'is_anomaly' column
    target_col : str
        Target column name
    metadata_cols : list
        List of metadata column names
    mode : str
        How to handle anomalies:
        - "drop": Remove anomalous rows entirely
        - "interpolate": Replace anomaly values with linear interpolation
        - "ffill": Forward fill from last good value
        - "none": Keep anomalies in training data

    Returns
    -------
    DataFrame
        Cleaned history data
    """
    cols = ["timestamp", target_col] + metadata_cols

    if mode == "none":
        return df[cols].copy()

    elif mode == "drop":
        return df[df["is_anomaly"] == 0][cols].copy()

    elif mode == "interpolate":
        clean_df = df[cols].copy()
        anomaly_mask = df["is_anomaly"] == 1
        for col in [target_col] + metadata_cols:
            clean_df.loc[anomaly_mask, col] = np.nan
        clean_df = clean_df.interpolate(method="linear")
        return clean_df

    elif mode == "ffill":
        clean_df = df[cols].copy()
        anomaly_mask = df["is_anomaly"] == 1
        for col in [target_col] + metadata_cols:
            clean_df.loc[anomaly_mask, col] = np.nan
        clean_df = clean_df.ffill()
        return clean_df

    else:
        raise ValueError(
            f"Unknown mode: {mode}. Use 'drop', 'interpolate', 'ffill', or 'none'"
        )
4. Run Anomaly Detection
We compare five approaches to understand the impact of multivariate context:| Method | Description | Metadata | Leak |
|---|---|---|---|
| Synthefy Univariate | Synthefy with only timestamp + target | ❌ | ❌ |
| Synthefy Multivariate | Synthefy with metadata columns | ✅ | ❌ |
| Synthefy Multi + Leak | Synthefy with metadata + future values | ✅ | ✅ |
| Prophet | Facebook’s univariate forecasting | ❌ | ❌ |
| Z-Score | Statistical baseline | ❌ | ❌ |
What is “Leaking”? Leak columns provide the model with actual future values of metadata columns. In practice, this is useful when you have scheduled events (maintenance windows, marketing campaigns) or real-time streaming data where metadata arrives before or with the target metric.
For anomaly detection, leaking is particularly useful to diagnose anomalies right after they happen, since we can predict what the cpu percent SHOULD have been, given the other signals.
Show metrics computation code
Show metrics computation code
def compute_metrics(errors, test_labels, optimize_metric="f1"):
    """Compute anomaly detection metrics from errors.

    Args:
        errors: Array of error/anomaly scores
        test_labels: Ground truth labels (0/1)
        optimize_metric: "f1", "precision", "recall", or None for fixed ANOMALY_PERCENTILE threshold.
    """
    if optimize_metric:
        # Find optimal threshold that maximizes the specified metric
        best_score = 0
        best_threshold = np.percentile(errors, ANOMALY_PERCENTILE)
        best_precision = 0
        best_recall = 0
        best_f1 = 0
        best_predictions = None

        # Try different percentile thresholds from 70 to 99
        for percentile in range(70, 100):
            threshold = np.percentile(errors, percentile)
            predicted = (errors > threshold).astype(int)
            precision = precision_score(test_labels, predicted, zero_division=0)
            recall = recall_score(test_labels, predicted, zero_division=0)
            f1 = f1_score(test_labels, predicted, zero_division=0)

            # Select metric to optimize
            if optimize_metric.lower() == "f1":
                score = f1
            elif optimize_metric.lower() == "precision":
                score = precision
            elif optimize_metric.lower() == "recall":
                score = recall
            else:
                raise ValueError(f"Unknown optimize_metric: {optimize_metric}")

            if score > best_score:
                best_score = score
                best_threshold = threshold
                best_precision = precision
                best_recall = recall
                best_f1 = f1
                best_predictions = predicted

        threshold = best_threshold
        predicted_anomalies = (
            best_predictions
            if best_predictions is not None
            else (errors > threshold).astype(int)
        )
        precision = best_precision
        recall = best_recall
        f1 = best_f1
    else:
        # Use fixed percentile threshold
        threshold = np.percentile(errors, ANOMALY_PERCENTILE)
        predicted_anomalies = (errors > threshold).astype(int)
        precision = precision_score(test_labels, predicted_anomalies, zero_division=0)
        recall = recall_score(test_labels, predicted_anomalies, zero_division=0)
        f1 = f1_score(test_labels, predicted_anomalies, zero_division=0)

    auroc = roc_auc_score(test_labels, errors)

    return {
        "threshold": threshold,
        "predicted_anomalies": predicted_anomalies,
        "metrics": {
            "precision": precision,
            "recall": recall,
            "f1": f1,
            "auroc": auroc,
        },
    }
Show full anomaly detection code
Show full anomaly detection code
The key difference between the three Synthefy variants is how the The full implementation handles batching, Prophet/Z-score baselines, and dynamic model selection based on
target_df is constructed:def run_anomaly_detection(df, target_col, metadata_cols, clean_mode="drop", run_models=RUN_MODELS):
"""
Run Synthefy (3 variants), Prophet, and Z-score for comparison.
"""
# Define split point for train/test
split_idx = int(len(df) - TOTAL_FORECAST_INTERVALS)
forecast_timestamps = df.iloc[split_idx:]["timestamp"].values[:TOTAL_FORECAST_INTERVALS]
# Storage for each model's forecasts
synthefy_univariate_forecasts = []
synthefy_multivariate_forecasts = []
synthefy_multivariate_leak_forecasts = []
prophet_forecasts = []
zscore_values = []
with SynthefyAPIClient() as client:
for forecast_ts in forecast_timestamps:
history_cleaned = clean_history(...)
current_row = df[df["timestamp"] == forecast_ts]
# === SYNTHEFY UNIVARIATE ===
# Only timestamp + target, no metadata
history_univariate = history_cleaned[["timestamp", target_col]].copy()
target_df_univariate = pd.DataFrame({
"timestamp": [forecast_ts],
target_col: [np.nan], # Value to predict
})
# === SYNTHEFY MULTIVARIATE (NO LEAK) ===
# Include metadata in history, but set to NaN in target_df
target_df_multivariate = pd.DataFrame({
"timestamp": [forecast_ts],
target_col: [np.nan],
**{col: [np.nan] for col in metadata_cols}, # NaN = no leak
})
# === SYNTHEFY MULTIVARIATE + LEAK ===
# Include metadata in history AND provide actual future values
target_df_multivariate_leak = pd.DataFrame({
"timestamp": [forecast_ts],
target_col: [np.nan],
**{col: [current_row[col].values[0]] for col in metadata_cols}, # Actual values = leak
})
# Run Synthefy forecasts
result_uni = client.forecast_dfs(
history_dfs=[history_univariate],
target_dfs=[target_df_univariate],
metadata_cols=[],
leak_cols=[],
model=SYNTHEFY_MODEL,
)
result_multi = client.forecast_dfs(
history_dfs=[history_cleaned],
target_dfs=[target_df_multivariate],
metadata_cols=metadata_cols,
leak_cols=[], # No leak
model=SYNTHEFY_MODEL,
)
result_leak = client.forecast_dfs(
history_dfs=[history_cleaned],
target_dfs=[target_df_multivariate_leak],
metadata_cols=metadata_cols,
leak_cols=metadata_cols, # Leak enabled
model=SYNTHEFY_MODEL,
)
# Compute errors and metrics for each model...
# Return results dictionary with all model outputs
RUN_MODELS. See the complete script for details.5. Compare Results
Let’s compare the performance across all five methods:# Run detection and extract results
results = run_anomaly_detection(df, TARGET_COL, METADATA_COLS, clean_mode=CLEAN_MODE, run_models=RUN_MODELS)
# Extract results for enabled models
results_synthefy_uni = results.get("synthefy_univariate")
results_synthefy_multi = results.get("synthefy_multivariate")
results_synthefy_leak = results.get("synthefy_multivariate_leak")
results_prophet = results.get("prophet")
results_zscore = results.get("zscore")
# Build comparison table dynamically
comparison_data = {"Metric": ["Precision", "Recall", "F1", "AUROC"]}
if results_synthefy_uni:
comparison_data["Synthefy (Uni)"] = [...]
if results_synthefy_multi:
comparison_data["Synthefy (Multi)"] = [...]
# ... etc for other models
comparison_df = pd.DataFrame(comparison_data)
print(comparison_df.to_markdown(index=False))
| Metric | Synthefy (Uni) | Synthefy (Multi) | Synthefy (Leak) | Prophet | Z-Score |
|---|---|---|---|---|---|
| Precision | 0.448 | 0.667 | 0.517 | 0.647 | 0.483 |
| Recall | 0.382 | 0.471 | 0.441 | 0.324 | 0.412 |
| F1 | 0.413 | 0.552 | 0.476 | 0.431 | 0.444 |
| AUROC | 0.569 | 0.618 | 0.621 | 0.547 | 0.501 |
6. Visualize Results
Show plotting code
Show plotting code
# Build list of plots based on which models ran (using COLORS dictionary)
plot_configs = []
if results_synthefy_uni:
    plot_configs.append(("synthefy_univariate", "Synthefy Univariate", COLORS["synthefy_univariate"], results_synthefy_uni))
if results_synthefy_multi:
    plot_configs.append(("synthefy_multivariate", "Synthefy Multivariate", COLORS["synthefy_multivariate"], results_synthefy_multi))
if results_synthefy_leak:
    plot_configs.append(("synthefy_multivariate_leak", "Synthefy Multi+Leak", COLORS["synthefy_multivariate_leak"], results_synthefy_leak))
if results_prophet:
    plot_configs.append(("prophet", "Prophet", COLORS["prophet"], results_prophet))
if results_zscore:
    plot_configs.append(("zscore", "Z-Score", COLORS["zscore"], results_zscore))

# Number of subplots = individual models only
n_plots = len(plot_configs)
split_idx = results["split_idx"]
test_subset = df.iloc[split_idx:].iloc[:TOTAL_FORECAST_INTERVALS]

# Helper function to get anomaly regions
def get_anomaly_regions(test_df):
    anom_mask = test_df["is_anomaly"] == 1
    anom_indices = test_df.index[anom_mask].tolist()
    if not anom_indices:
        return []
    regions = []
    start = anom_indices[0]
    end = anom_indices[0]
    for idx in anom_indices[1:]:
        if idx == end + 1:
            end = idx
        else:
            regions.append((start, end))
            start = idx
            end = idx
    regions.append((start, end))
    return regions

anomaly_regions = get_anomaly_regions(test_subset)

# ========================================================================
# Plot 1: Individual Model Forecasts
# ========================================================================
fig1, axes = plt.subplots(n_plots, 1, figsize=(14, 3 * n_plots), sharex=True)
if n_plots == 1:
    axes = [axes]

# Plot each model
for plot_idx, (model_key, model_name, color, model_results) in enumerate(plot_configs):
    ax = axes[plot_idx]

    # Highlight anomaly regions with red background
    for i, (start_idx, end_idx) in enumerate(anomaly_regions):
        ax.axvspan(
            test_subset.loc[start_idx, "timestamp"],
            test_subset.loc[end_idx, "timestamp"],
            color=COLORS["anomaly"],
            alpha=0.2,
            label="True Anomaly Region" if i == 0 else None,
        )

    if model_key == "zscore":
        zscore_df = model_results["scores_df"]
        ax.plot(
            zscore_df["timestamp"],
            zscore_df["zscore"],
            color,
            linewidth=1.5,
            label="Z-Score Anomaly Score",
            alpha=0.7,
        )
        ax.axhline(y=2, color="gray", linestyle="--", alpha=0.5, label="Threshold (Z=2)")
        ax.axhline(y=3, color="gray", linestyle=":", alpha=0.5, label="Threshold (Z=3)")
        ax.set_ylabel("Z-Score", fontweight="bold")
    else:
        forecast_df = model_results["forecast_df"]
        ax.plot(
            test_subset["timestamp"],
            test_subset[TARGET_COL],
            color=COLORS["groundtruth"],
            linewidth=1.5,
            label="Actual Value",
            alpha=0.7,
        )
        ax.plot(
            forecast_df["timestamp"],
            forecast_df[TARGET_COL],
            color,
            linewidth=1.5,
            label=f"{model_name} Forecast",
            alpha=0.7,
        )
        ylabel = TARGET_COL.replace("_", " ").title()
        if "%" in ylabel:
            ax.set_ylabel(ylabel, fontweight="bold")
        else:
            ax.set_ylabel(f"{ylabel} (%)", fontweight="bold")

    ax.set_title(
        f"{model_name} - Forecast vs Actual (AUROC: {model_results['metrics']['auroc']:.3f})",
        fontweight="bold",
    )
    ax.legend(loc="upper left", fontsize=9)
    ax.grid(True, alpha=0.3)

axes[-1].set_xlabel("Time", fontweight="bold")
plt.tight_layout()
plt.savefig("anomaly_detection/anomaly_detection_results.png", dpi=150, bbox_inches="tight")
plt.show()

# ========================================================================
# Plot 2: Anomaly Scores Comparison (separate figure)
# ========================================================================
if len(plot_configs) > 1:
    fig2, ax = plt.subplots(1, 1, figsize=(14, 6))

    # Highlight anomaly regions
    for i, (start_idx, end_idx) in enumerate(anomaly_regions):
        ax.axvspan(
            test_subset.loc[start_idx, "timestamp"],
            test_subset.loc[end_idx, "timestamp"],
            color=COLORS["anomaly"],
            alpha=0.2,
            label="True Anomaly Region" if i == 0 else None,
        )

    # Define line styles for different model types
    line_styles = {
        "synthefy_univariate": "-",  # solid
        "synthefy_multivariate": "-",  # solid
        "synthefy_multivariate_leak": "-",  # solid
        "prophet": ":",  # dotted
        "zscore": ":",  # dotted
    }

    for model_key, model_name, color, model_results in plot_configs:
        errors = model_results["errors"]
        norm_errors = errors / np.max(errors) if np.max(errors) > 0 else errors

        if model_key == "zscore":
            timestamps = model_results["scores_df"]["timestamp"]
            label = f"{model_name}"
        else:
            timestamps = model_results["forecast_df"]["timestamp"]
            label = f"{model_name}"

        linestyle = line_styles.get(model_key, "-")
        linewidth = 2.0 if "synthefy" in model_key else 1.5

        ax.plot(
            timestamps,
            norm_errors,
            color,
            linestyle=linestyle,
            linewidth=linewidth,
            label=label,
            alpha=0.8,
        )

    ax.set_ylabel("Normalized Anomaly Score [0-1]", fontweight="bold")
    ax.set_xlabel("Time", fontweight="bold")
    ax.set_title("Anomaly Detection Scores Comparison", fontweight="bold", fontsize=12)
    ax.legend(loc="center left", bbox_to_anchor=(1, 0.5), fontsize=9, framealpha=0.95)
    ax.grid(True, alpha=0.2, linestyle="--")

    plt.tight_layout()
    plt.savefig("anomaly_detection/anomaly_scores_comparison.png", dpi=150, bbox_inches="tight")
    plt.show()
Example Output: Anomaly Detection Comparison
Plot 1: Individual Model Forecasts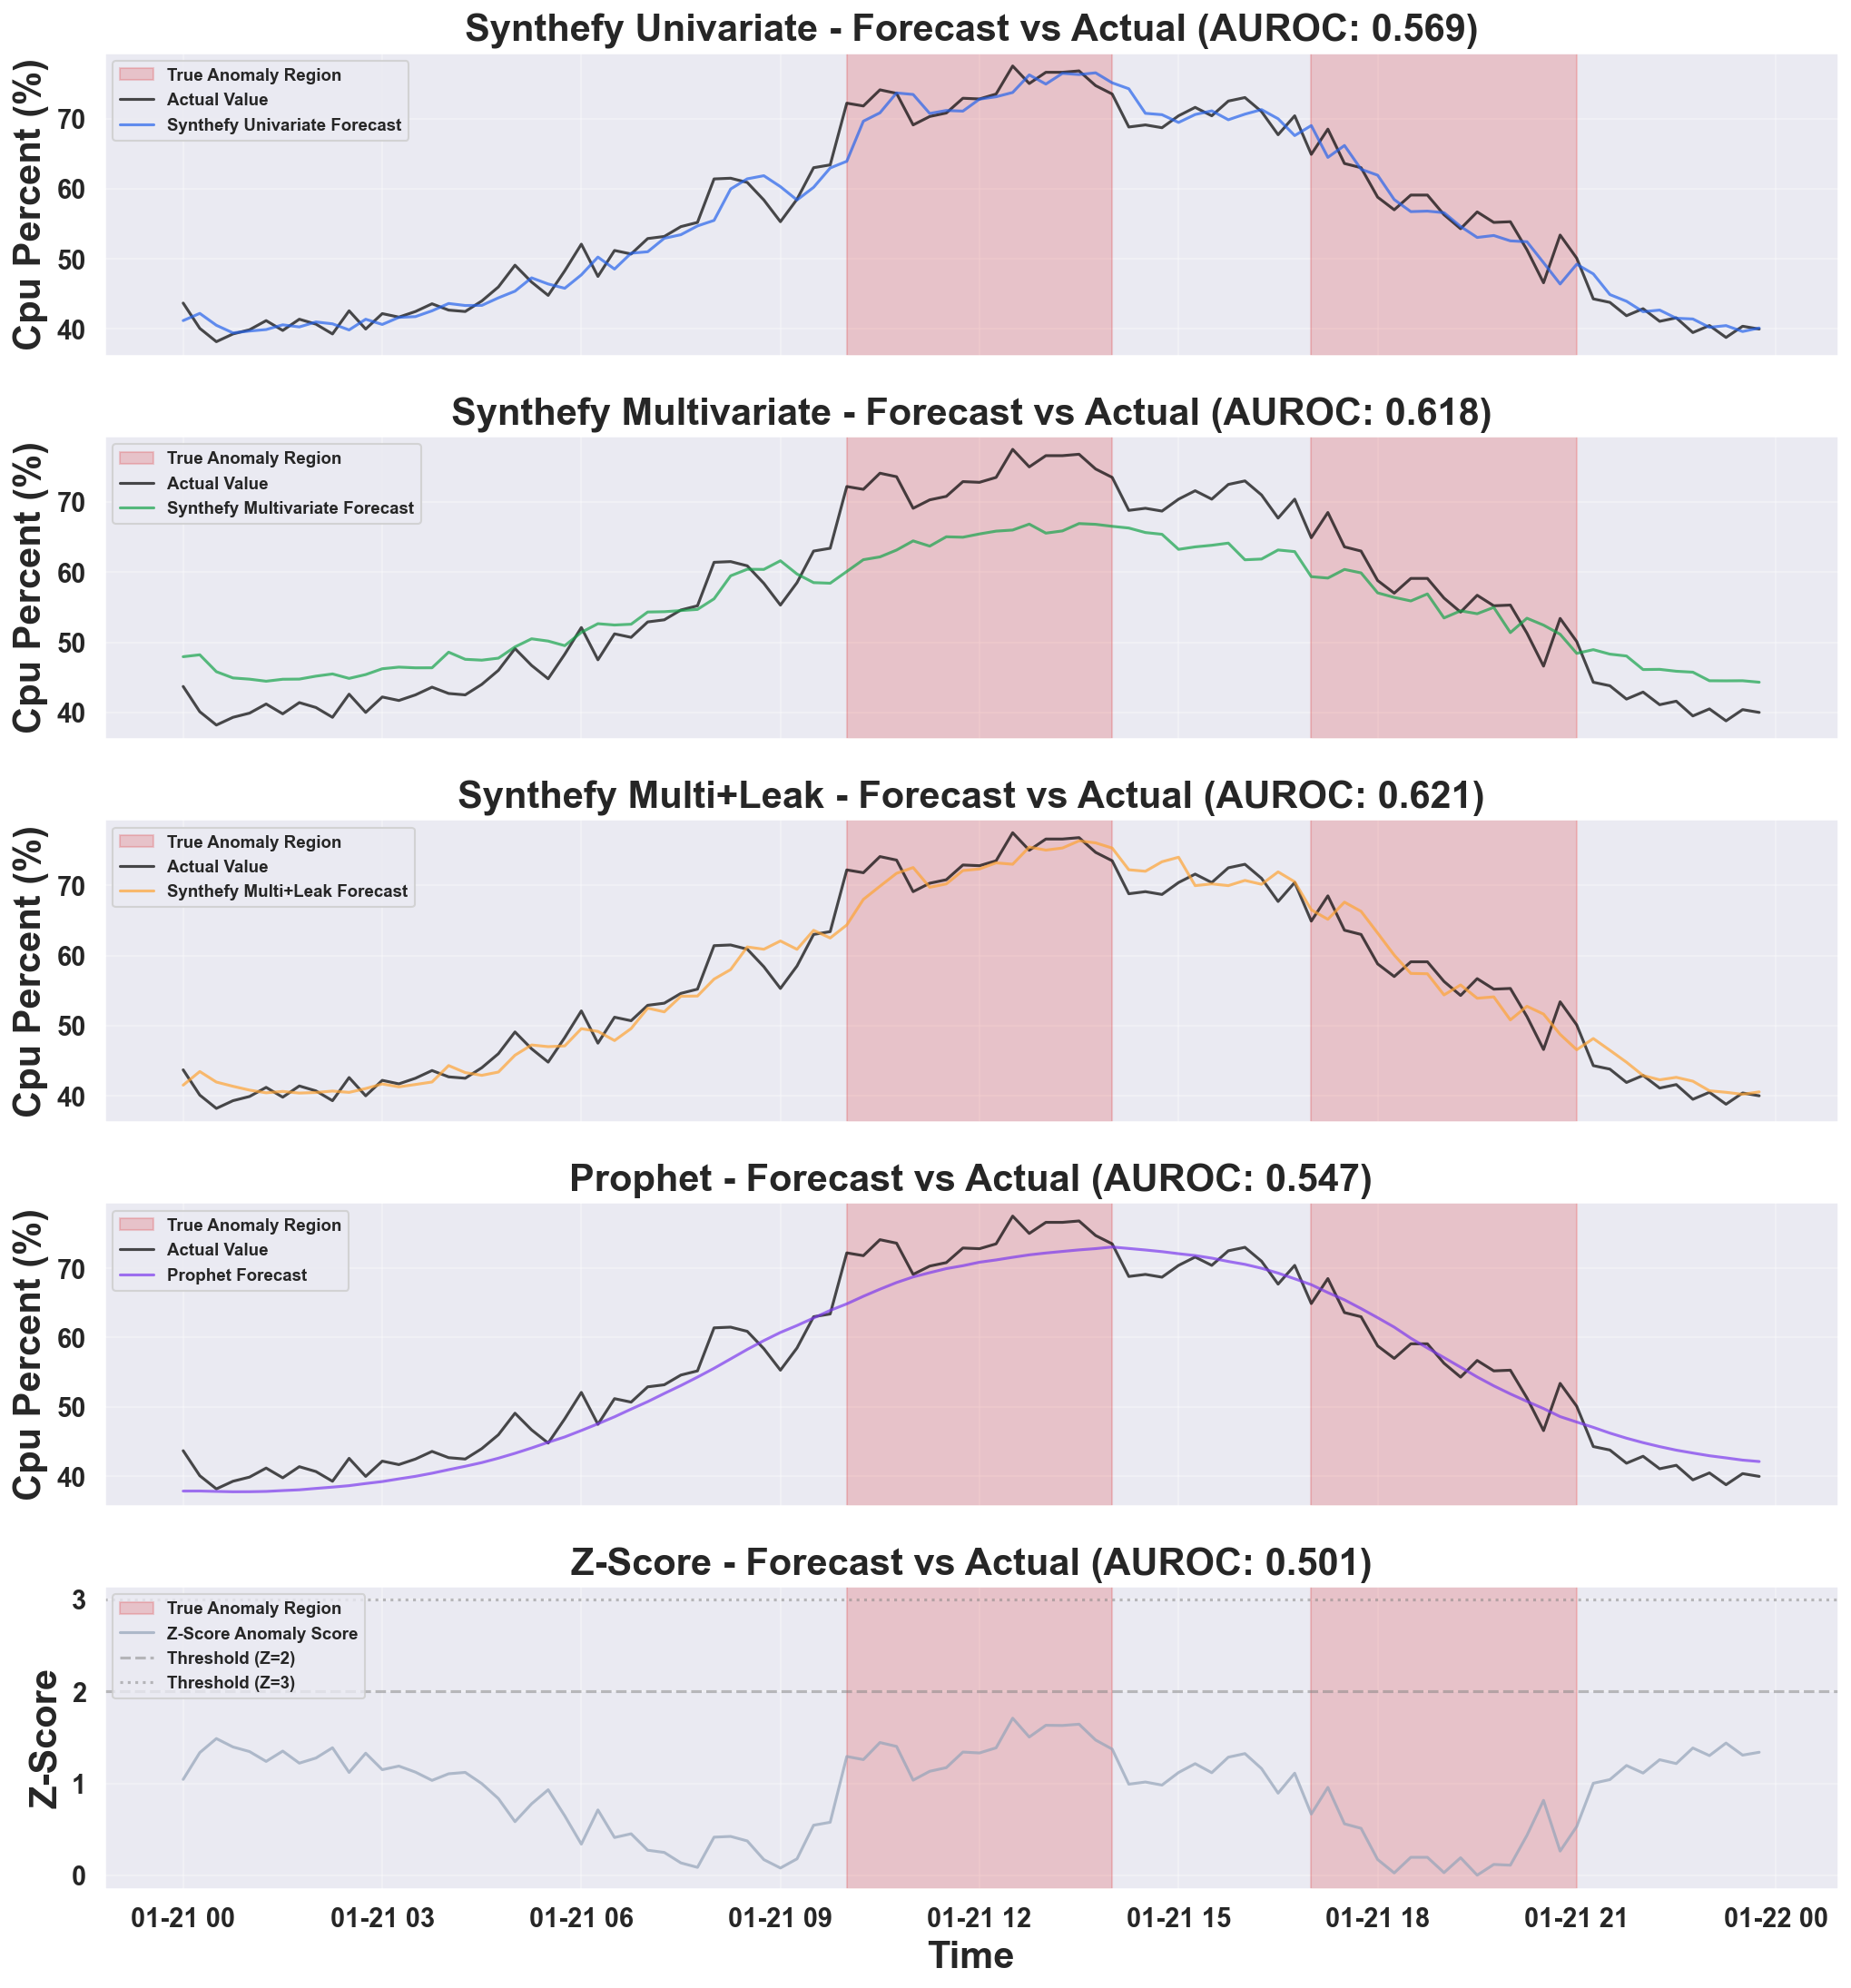
- Synthefy Univariate: Baseline Synthefy with only the target column - captures temporal patterns but misses cross-metric context
- Synthefy Multivariate: Adds metadata columns - learns relationships between CPU and memory/network
- Synthefy Multi+Leak: Provides future metadata values - best performance when future context is available
- Prophet: Facebook’s univariate forecasting - captures seasonality well, but not as robust as Synthefy models
- Z-Score: Simple statistical baseline - constant thresholds that don’t adapt to patterns
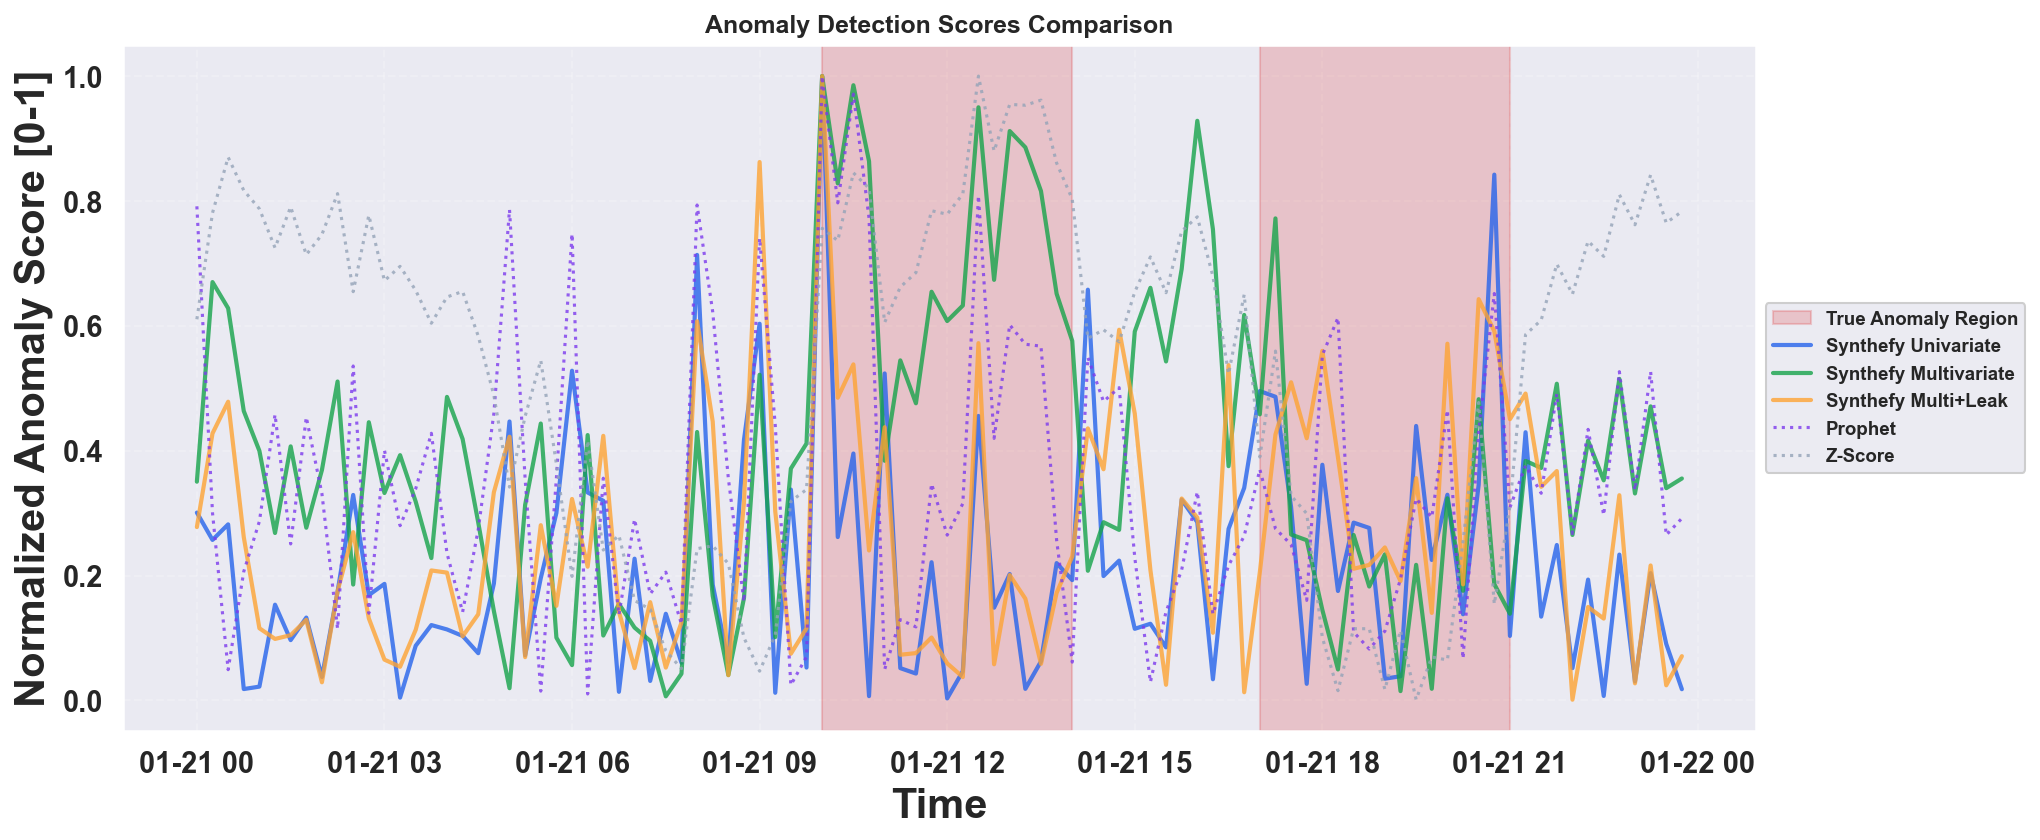
- Synthefy models use solid lines; baseline models (Prophet, Z-Score) use dotted lines
- Higher scores indicate more anomalous points
- Easier to compare relative anomaly detection performance across methods
Key Insights
From this analysis, you can answer critical questions:- How much does multivariate context help? → Compare Synthefy Univariate vs Multivariate AUROC
- When should I use leak columns? → Use when future metadata is known (scheduled events, streaming data)
- Which metrics are correlated? → Experiment with different
METADATA_COLScombinations - What’s the right threshold? → Adjust
ANOMALY_PERCENTILEbased on your false positive tolerance
Alternative Multivariate Anomaly Detection Approach: Instead of detecting anomalies in a single target column, you can perform true multivariate anomaly detection by:
- Forecast all columns: For each column in your dataset, use all other columns as covariates to predict it
- Compute errors: Calculate forecast errors for each column
- Aggregate errors: Combine errors across all columns (e.g., sum or weighted average)
- Flag anomalies: Points with high aggregated errors are flagged as anomalies. You could also train a separate model to predict anomalies based on the errors.
Complete Code
Show minimal working example
Show minimal working example
# %% [markdown]
"""
# Multivariate Anomaly Detection Demo using Synthefy Forecasting API
This demo demonstrates anomaly detection using time series forecasting:
**Forecast-Error Based Detection**
- Forecast each metric using historical patterns
- Compute forecast errors (residuals)
- Flag points with large errors as anomalies
- Works well for detecting deviations from expected patterns
Reference: Common anomaly detection approaches use forecasting models to identify
deviations between predicted and actual values, signaling potential anomalies.
"""
# %%
import logging
import os
import matplotlib.pyplot as plt
import numpy as np
import pandas as pd
from prophet import Prophet
from sklearn.metrics import (
f1_score,
precision_score,
recall_score,
roc_auc_score,
)
from synthefy import SynthefyAPIClient
# Suppress Prophet/cmdstanpy logging
logging.getLogger("cmdstanpy").setLevel(logging.WARNING)
logging.getLogger("prophet").setLevel(logging.WARNING)
# Set up API key
os.environ["SYNTHEFY_API_KEY"] = os.getenv("SYNTHEFY_API_KEY", "")
# ============================================================================
# Constants
# ============================================================================
FORECAST_DAYS = 1 # Forecast last day
INTERVALS_PER_HOUR = 4 # 15-minute intervals per hour
TOTAL_FORECAST_INTERVALS = int(
int(FORECAST_DAYS * 24 * INTERVALS_PER_HOUR)
) # 96 intervals (1 day)
BATCH_SIZE = 1 # Number of forecasts per API call
ANOMALY_PERCENTILE = 90 # Top N% of errors are flagged as anomalies (fallback if not optimizing)
OPTIMIZE_METRIC = "f1" # Optimize threshold for: "f1", "precision", "recall", or None for fixed percentile
CLEAN_MODE = "interpolate" # How to handle anomalies in history: "drop", "interpolate", "ffill", "none"
# Target and metadata configuration
TARGET_COL = "cpu_percent" # Column to forecast and detect anomalies in
METADATA_COLS = [ # Additional features to use as context (excludes target)
"memory_percent",
"network_mbps",
]
# Models to run (set to False to skip)
RUN_MODELS = {
"synthefy_univariate": True, # Synthefy with only target column
"synthefy_multivariate": True, # Synthefy with metadata columns (no leak)
"synthefy_multivariate_leak": True, # Synthefy with metadata + leak columns
"prophet": True, # Facebook Prophet (univariate baseline)
"zscore": True, # Z-score statistical baseline
}
SYNTHEFY_MODEL = "Migas-1.0"
print(f"Metadata columns: {METADATA_COLS}, target column: {TARGET_COL}")
print(f"Models to run: {[k for k, v in RUN_MODELS.items() if v]}")
# %%
# ============================================================================
# Load Data
# ============================================================================
data_link = (
"https://drive.google.com/uc?export=download&id=1wys6MdTyRtWsiFGGsGo7sH3tvBBXoOQZ"
)
df = pd.read_csv(data_link)
df["timestamp"] = pd.to_datetime(df["timestamp"])
print(f"Data shape: {df.shape}")
print(f"Date range: {df['timestamp'].min()} to {df['timestamp'].max()}")
print(f"Anomaly rate: {df['is_anomaly'].mean():.2%}")
# %%
# ============================================================================
# Visualize Raw Data with Anomalies
# ============================================================================
print("\n📈 Visualizing raw data with anomalies...")
fig, axes = plt.subplots(3, 1, figsize=(25, 16), sharex=True)
features = [
("cpu_percent", "CPU (%)", "#2563eb"),
("memory_percent", "Memory (%)", "#16a34a"),
("network_mbps", "Network (MB/s)", "#ea580c"),
]
for ax, (col, label, color) in zip(axes, features):
ax.plot(df["timestamp"], df[col], color=color, alpha=0.8, linewidth=1.2)
# Highlight anomaly regions with red background
anom_mask = df["is_anomaly"] == 1
anom_indices = df.index[anom_mask].tolist()
# Group consecutive anomaly indices into regions
if anom_indices:
regions = []
start = anom_indices[0]
end = anom_indices[0]
for idx in anom_indices[1:]:
if idx == end + 1:
end = idx
else:
regions.append((start, end))
start = idx
end = idx
regions.append((start, end))
# Draw red regions
for start_idx, end_idx in regions:
ax.axvspan(
df.loc[start_idx, "timestamp"],
df.loc[end_idx, "timestamp"],
color="red",
alpha=0.2,
label="Anomaly" if start_idx == regions[0][0] else None,
)
ax.set_ylabel(label, fontsize=11)
ax.grid(True, alpha=0.3, linestyle="--")
# Add day separators (every day) - 96 intervals per day
dates = df["timestamp"].values
for i in range(1, 14):
if i * 96 < len(dates):
ax.axvline(dates[i * 96], color="gray", alpha=0.2, linestyle=":")
axes[0].set_title(
"Multivariate Anomaly Detection Dataset\n2 Weeks of Server Monitoring (15-Minute Intervals)",
fontsize=14,
fontweight="bold",
pad=15,
)
axes[0].legend(loc="upper right", fontsize=9)
axes[-1].set_xlabel("Time", fontsize=12)
plt.tight_layout()
os.makedirs("usecases/anomaly_detection", exist_ok=True)
plt.savefig(
"usecases/anomaly_detection/multivariate_anomaly_visualization.png",
dpi=150,
bbox_inches="tight",
)
plt.show()
print(
"✅ Saved: usecases/anomaly_detection/multivariate_anomaly_visualization.png"
)
# %%
# ============================================================================
# Helper: Clean History Data (Remove/Handle Anomalies)
# ============================================================================
def clean_history(df, target_col, metadata_cols, mode="drop"):
"""
Clean history data by handling anomalous points.
Parameters
----------
df : DataFrame
Input data with 'is_anomaly' column
target_col : str
Target column name
metadata_cols : list
List of metadata column names
mode : str
How to handle anomalies:
- "drop": Remove anomalous rows entirely (creates gaps)
- "interpolate": Replace anomaly values with linear interpolation
- "ffill": Forward fill from last good value
- "none": Keep anomalies in training data
Returns
-------
DataFrame
Cleaned history data
"""
cols = ["timestamp", target_col] + metadata_cols
if mode == "none":
return df[cols].copy()
elif mode == "drop":
return df[df["is_anomaly"] == 0][cols].copy()
elif mode == "interpolate":
clean_df = df[cols].copy()
# Set anomaly values to NaN, then interpolate
anomaly_mask = df["is_anomaly"] == 1
for col in [target_col] + metadata_cols:
clean_df.loc[anomaly_mask, col] = np.nan
clean_df = clean_df.interpolate(method="linear")
return clean_df
elif mode == "ffill":
clean_df = df[cols].copy()
# Set anomaly values to NaN, then forward fill
anomaly_mask = df["is_anomaly"] == 1
for col in [target_col] + metadata_cols:
clean_df.loc[anomaly_mask, col] = np.nan
clean_df = clean_df.ffill()
return clean_df
else:
raise ValueError(
f"Unknown mode: {mode}. Use 'drop', 'interpolate', 'ffill', or 'none'"
)
# %%
# ============================================================================
# Combined Anomaly Detection: Synthefy + Prophet in Same Loop
# ============================================================================
def compute_metrics(errors, test_labels, optimize_metric="f1"):
"""Compute anomaly detection metrics from errors.
Args:
errors: Array of error/anomaly scores
test_labels: Ground truth labels (0/1)
optimize_metric: "f1", "precision", "recall", or None for fixed ANOMALY_PERCENTILE threshold.
"""
if optimize_metric:
# Find optimal threshold that maximizes the specified metric
best_score = 0
best_threshold = np.percentile(errors, ANOMALY_PERCENTILE)
best_precision = 0
best_recall = 0
best_f1 = 0
best_predictions = None
# Try different percentile thresholds from 70 to 99
for percentile in range(70, 100):
threshold = np.percentile(errors, percentile)
predicted = (errors > threshold).astype(int)
precision = precision_score(test_labels, predicted, zero_division=0)
recall = recall_score(test_labels, predicted, zero_division=0)
f1 = f1_score(test_labels, predicted, zero_division=0)
# Select metric to optimize
if optimize_metric.lower() == "f1":
score = f1
elif optimize_metric.lower() == "precision":
score = precision
elif optimize_metric.lower() == "recall":
score = recall
else:
raise ValueError(f"Unknown optimize_metric: {optimize_metric}")
if score > best_score:
best_score = score
best_threshold = threshold
best_precision = precision
best_recall = recall
best_f1 = f1
best_predictions = predicted
threshold = best_threshold
predicted_anomalies = (
best_predictions
if best_predictions is not None
else (errors > threshold).astype(int)
)
precision = best_precision
recall = best_recall
f1 = best_f1
else:
# Use fixed percentile threshold
threshold = np.percentile(errors, ANOMALY_PERCENTILE)
predicted_anomalies = (errors > threshold).astype(int)
precision = precision_score(test_labels, predicted_anomalies, zero_division=0)
recall = recall_score(test_labels, predicted_anomalies, zero_division=0)
f1 = f1_score(test_labels, predicted_anomalies, zero_division=0)
auroc = roc_auc_score(test_labels, errors)
return {
"threshold": threshold,
"predicted_anomalies": predicted_anomalies,
"metrics": {
"precision": precision,
"recall": recall,
"f1": f1,
"auroc": auroc,
},
}
def run_anomaly_detection(
df, target_col, metadata_cols, clean_mode="interpolate", run_models=RUN_MODELS
):
"""
Run Synthefy (3 variants), Prophet, and Z-score for comparison.
Synthefy variants:
1. Univariate: No metadata, no leak (time series only)
2. Multivariate: With metadata, no leak
3. Multivariate + Leak: With metadata and leak columns
"""
# Suppress Prophet logging
import logging
logging.getLogger("prophet").setLevel(logging.WARNING)
logging.getLogger("cmdstanpy").setLevel(logging.WARNING)
# Define split point
split_idx = int(len(df) - TOTAL_FORECAST_INTERVALS)
forecast_timestamps = df.iloc[split_idx:]["timestamp"].values[
:TOTAL_FORECAST_INTERVALS
]
# Forecast storage for each model
synthefy_univariate_forecasts = []
synthefy_multivariate_forecasts = []
synthefy_multivariate_leak_forecasts = []
prophet_forecasts = []
zscore_values = []
n_batches = (len(forecast_timestamps) + BATCH_SIZE - 1) // BATCH_SIZE
# Determine which models are running
running_models = [k for k, v in run_models.items() if v]
print(f"Clean mode: {clean_mode}")
print(
f"Rolling forecast: {len(forecast_timestamps)} steps in {n_batches} batches..."
)
print(f"Running models: {running_models}\n")
# Use context manager only if running any Synthefy model
client = SynthefyAPIClient()
if client:
client.__enter__()
try:
for batch_idx in range(n_batches):
batch_start = batch_idx * BATCH_SIZE
batch_end = min(batch_start + BATCH_SIZE, len(forecast_timestamps))
batch_timestamps = forecast_timestamps[batch_start:batch_end]
# Build batch inputs for Synthefy methods
history_dfs_univariate = []
target_dfs_univariate = []
history_dfs_multivariate = []
target_dfs_multivariate = []
target_dfs_multivariate_leak = []
for forecast_ts in batch_timestamps:
# Get and clean history
history_raw = df[df["timestamp"] < forecast_ts]
current_row = df[df["timestamp"] == forecast_ts]
history_cleaned = clean_history(
history_raw, target_col, metadata_cols, mode=clean_mode
)
# Get current actual value for Z-score
current_value = current_row[target_col].values[0]
# Z-score: compute from cleaned history
if run_models.get("zscore", False):
history_values = history_cleaned[target_col].values
hist_mean = np.mean(history_values)
hist_std = np.std(history_values)
if hist_std > 0:
zscore = np.abs((current_value - hist_mean) / hist_std)
else:
zscore = 0.0
zscore_values.append(zscore)
# Univariate: only timestamp and target
if run_models.get("synthefy_univariate", False):
history_univariate = history_cleaned[
["timestamp", target_col]
].copy()
target_df_univariate = pd.DataFrame(
{
"timestamp": [forecast_ts],
target_col: [np.nan],
}
)
history_dfs_univariate.append(history_univariate)
target_dfs_univariate.append(target_df_univariate)
# Multivariate (no leak): metadata columns are NaN
if run_models.get(
"synthefy_multivariate", False
) or run_models.get("synthefy_multivariate_leak", False):
history_dfs_multivariate.append(history_cleaned)
if run_models.get("synthefy_multivariate", False):
metadata_dict_nan = {
col: [np.nan] for col in metadata_cols
}
target_df_multivariate_no_leak = pd.DataFrame(
{
"timestamp": [forecast_ts],
target_col: [np.nan],
**metadata_dict_nan,
}
)
target_dfs_multivariate.append(
target_df_multivariate_no_leak
)
# Multivariate + Leak: metadata columns have actual values
if run_models.get("synthefy_multivariate_leak", False):
metadata_dict_leak = {
col: [current_row[col].values[0]]
for col in metadata_cols
}
target_df_multivariate_leak = pd.DataFrame(
{
"timestamp": [forecast_ts],
target_col: [np.nan],
**metadata_dict_leak,
}
)
target_dfs_multivariate_leak.append(
target_df_multivariate_leak
)
# Prophet: fit and forecast (univariate)
if run_models.get("prophet", False):
prophet_df = pd.DataFrame(
{
"ds": history_cleaned["timestamp"],
"y": history_cleaned[target_col],
}
)
prophet_model = Prophet(
daily_seasonality=True,
weekly_seasonality=True,
yearly_seasonality=False,
)
prophet_model.fit(prophet_df)
future = pd.DataFrame({"ds": [pd.Timestamp(forecast_ts)]})
forecast = prophet_model.predict(future)
prophet_forecasts.append(forecast["yhat"].iloc[0])
# Synthefy 1: Univariate (no metadata, no leak)
if run_models.get("synthefy_univariate", False) and client:
results_univariate = client.forecast_dfs(
history_dfs=history_dfs_univariate,
target_dfs=target_dfs_univariate,
target_col=target_col,
timestamp_col="timestamp",
metadata_cols=[],
leak_cols=[],
model=SYNTHEFY_MODEL,
)
for result in results_univariate:
synthefy_univariate_forecasts.append(
result[target_col].iloc[0]
)
# Synthefy 2: Multivariate (with metadata, no leak)
if run_models.get("synthefy_multivariate", False) and client:
results_multivariate = client.forecast_dfs(
history_dfs=history_dfs_multivariate,
target_dfs=target_dfs_multivariate,
target_col=target_col,
timestamp_col="timestamp",
metadata_cols=metadata_cols,
leak_cols=[],
model=SYNTHEFY_MODEL,
)
for result in results_multivariate:
synthefy_multivariate_forecasts.append(
result[target_col].iloc[0]
)
# Synthefy 3: Multivariate + Leak (with metadata and leak)
if run_models.get("synthefy_multivariate_leak", False) and client:
results_multivariate_leak = client.forecast_dfs(
history_dfs=history_dfs_multivariate,
target_dfs=target_dfs_multivariate_leak,
target_col=target_col,
timestamp_col="timestamp",
metadata_cols=metadata_cols,
leak_cols=metadata_cols,
model=SYNTHEFY_MODEL,
)
for result in results_multivariate_leak:
synthefy_multivariate_leak_forecasts.append(
result[target_col].iloc[0]
)
print(
f" Batch {batch_idx + 1}/{n_batches} complete ({batch_end} steps)"
)
finally:
if client:
client.__exit__(None, None, None)
# Get actual values and labels
actual_values = df.iloc[split_idx:][target_col].values[
:TOTAL_FORECAST_INTERVALS
]
test_labels = df.iloc[split_idx:]["is_anomaly"].values[
:TOTAL_FORECAST_INTERVALS
]
# Build results dictionary
results = {"split_idx": split_idx}
# Compute errors and metrics for each enabled model
if run_models.get("synthefy_univariate", False):
synthefy_univariate_values = np.array(synthefy_univariate_forecasts)
synthefy_univariate_errors = np.abs(
actual_values - synthefy_univariate_values
)
synthefy_univariate_results = compute_metrics(
synthefy_univariate_errors, test_labels, optimize_metric=OPTIMIZE_METRIC
)
synthefy_univariate_df = pd.DataFrame(
{
"timestamp": forecast_timestamps,
target_col: synthefy_univariate_values,
}
)
results["synthefy_univariate"] = {
"forecast_df": synthefy_univariate_df,
"errors": synthefy_univariate_errors,
**synthefy_univariate_results,
}
print("\n" + "=" * 60)
print("SYNTHEFY UNIVARIATE (no metadata, no leak)")
print("=" * 60)
print(
f"Precision: {synthefy_univariate_results['metrics']['precision']:.3f}"
)
print(f"Recall: {synthefy_univariate_results['metrics']['recall']:.3f}")
print(f"F1: {synthefy_univariate_results['metrics']['f1']:.3f}")
print(f"AUROC: {synthefy_univariate_results['metrics']['auroc']:.3f}")
if run_models.get("synthefy_multivariate", False):
synthefy_multivariate_values = np.array(synthefy_multivariate_forecasts)
synthefy_multivariate_errors = np.abs(
actual_values - synthefy_multivariate_values
)
synthefy_multivariate_results = compute_metrics(
synthefy_multivariate_errors, test_labels, optimize_metric=OPTIMIZE_METRIC
)
synthefy_multivariate_df = pd.DataFrame(
{
"timestamp": forecast_timestamps,
target_col: synthefy_multivariate_values,
}
)
results["synthefy_multivariate"] = {
"forecast_df": synthefy_multivariate_df,
"errors": synthefy_multivariate_errors,
**synthefy_multivariate_results,
}
print("\n" + "=" * 60)
print("SYNTHEFY MULTIVARIATE (with metadata, no leak)")
print("=" * 60)
print(
f"Precision: {synthefy_multivariate_results['metrics']['precision']:.3f}"
)
print(
f"Recall: {synthefy_multivariate_results['metrics']['recall']:.3f}"
)
print(f"F1: {synthefy_multivariate_results['metrics']['f1']:.3f}")
print(f"AUROC: {synthefy_multivariate_results['metrics']['auroc']:.3f}")
if run_models.get("synthefy_multivariate_leak", False):
synthefy_multivariate_leak_values = np.array(
synthefy_multivariate_leak_forecasts
)
synthefy_multivariate_leak_errors = np.abs(
actual_values - synthefy_multivariate_leak_values
)
synthefy_multivariate_leak_results = compute_metrics(
synthefy_multivariate_leak_errors, test_labels, optimize_metric=OPTIMIZE_METRIC
)
synthefy_multivariate_leak_df = pd.DataFrame(
{
"timestamp": forecast_timestamps,
target_col: synthefy_multivariate_leak_values,
}
)
results["synthefy_multivariate_leak"] = {
"forecast_df": synthefy_multivariate_leak_df,
"errors": synthefy_multivariate_leak_errors,
**synthefy_multivariate_leak_results,
}
print("\n" + "=" * 60)
print("SYNTHEFY MULTIVARIATE + LEAK (with metadata and leak)")
print("=" * 60)
print(
f"Precision: {synthefy_multivariate_leak_results['metrics']['precision']:.3f}"
)
print(
f"Recall: {synthefy_multivariate_leak_results['metrics']['recall']:.3f}"
)
print(f"F1: {synthefy_multivariate_leak_results['metrics']['f1']:.3f}")
print(
f"AUROC: {synthefy_multivariate_leak_results['metrics']['auroc']:.3f}"
)
if run_models.get("prophet", False):
prophet_values = np.array(prophet_forecasts)
prophet_errors = np.abs(actual_values - prophet_values)
prophet_results = compute_metrics(prophet_errors, test_labels, optimize_metric=OPTIMIZE_METRIC)
prophet_forecast_df = pd.DataFrame(
{"timestamp": forecast_timestamps, target_col: prophet_values}
)
results["prophet"] = {
"forecast_df": prophet_forecast_df,
"errors": prophet_errors,
**prophet_results,
}
print("\n" + "=" * 60)
print("PROPHET RESULTS")
print("=" * 60)
print(f"Precision: {prophet_results['metrics']['precision']:.3f}")
print(f"Recall: {prophet_results['metrics']['recall']:.3f}")
print(f"F1: {prophet_results['metrics']['f1']:.3f}")
print(f"AUROC: {prophet_results['metrics']['auroc']:.3f}")
if run_models.get("zscore", False):
zscore_scores = np.array(zscore_values)
zscore_results = compute_metrics(zscore_scores, test_labels, optimize_metric=OPTIMIZE_METRIC)
zscore_df = pd.DataFrame(
{"timestamp": forecast_timestamps, "zscore": zscore_scores}
)
results["zscore"] = {
"scores_df": zscore_df,
"errors": zscore_scores,
**zscore_results,
}
print("\n" + "=" * 60)
print("Z-SCORE RESULTS")
print("=" * 60)
print(f"Precision: {zscore_results['metrics']['precision']:.3f}")
print(f"Recall: {zscore_results['metrics']['recall']:.3f}")
print(f"F1: {zscore_results['metrics']['f1']:.3f}")
print(f"AUROC: {zscore_results['metrics']['auroc']:.3f}")
return results
# %%
# ============================================================================
# Run Anomaly Detection - Both Methods
# ============================================================================
results = run_anomaly_detection(
df, TARGET_COL, METADATA_COLS, clean_mode=CLEAN_MODE, run_models=RUN_MODELS
)
# Extract results for enabled models (None if not run)
results_synthefy_uni = results.get("synthefy_univariate")
results_synthefy_multi = results.get("synthefy_multivariate")
results_synthefy_leak = results.get("synthefy_multivariate_leak")
results_prophet = results.get("prophet")
results_zscore = results.get("zscore")
# %%
# ============================================================================
# Comparison Summary
# ============================================================================
print("\n" + "=" * 60)
print("COMPARISON")
print("=" * 60)
# Build comparison DataFrame dynamically based on which models ran
comparison_data = {"Metric": ["Precision", "Recall", "F1", "AUROC"]}
if results_synthefy_uni:
comparison_data["Synthefy (Uni)"] = [
results_synthefy_uni["metrics"]["precision"],
results_synthefy_uni["metrics"]["recall"],
results_synthefy_uni["metrics"]["f1"],
results_synthefy_uni["metrics"]["auroc"],
]
if results_synthefy_multi:
comparison_data["Synthefy (Multi)"] = [
results_synthefy_multi["metrics"]["precision"],
results_synthefy_multi["metrics"]["recall"],
results_synthefy_multi["metrics"]["f1"],
results_synthefy_multi["metrics"]["auroc"],
]
if results_synthefy_leak:
comparison_data["Synthefy (Leak)"] = [
results_synthefy_leak["metrics"]["precision"],
results_synthefy_leak["metrics"]["recall"],
results_synthefy_leak["metrics"]["f1"],
results_synthefy_leak["metrics"]["auroc"],
]
if results_prophet:
comparison_data["Prophet"] = [
results_prophet["metrics"]["precision"],
results_prophet["metrics"]["recall"],
results_prophet["metrics"]["f1"],
results_prophet["metrics"]["auroc"],
]
if results_zscore:
comparison_data["Z-Score"] = [
results_zscore["metrics"]["precision"],
results_zscore["metrics"]["recall"],
results_zscore["metrics"]["f1"],
results_zscore["metrics"]["auroc"],
]
comparison_df = pd.DataFrame(comparison_data)
comparison_df
# %%
# ============================================================================
# Visualization - Compare All Models
# ============================================================================
# Build list of plots to create based on which models ran
plot_configs = []
if results_synthefy_uni:
plot_configs.append(
(
"synthefy_univariate",
"Synthefy Univariate",
"#94a3b8",
results_synthefy_uni,
)
)
if results_synthefy_multi:
plot_configs.append(
(
"synthefy_multivariate",
"Synthefy Multivariate",
"#3b82f6",
results_synthefy_multi,
)
)
if results_synthefy_leak:
plot_configs.append(
(
"synthefy_multivariate_leak",
"Synthefy Multi+Leak",
"#2563eb",
results_synthefy_leak,
)
)
if results_prophet:
plot_configs.append(("prophet", "Prophet", "#16a34a", results_prophet))
if results_zscore:
plot_configs.append(("zscore", "Z-Score", "#f59e0b", results_zscore))
# Number of subplots = individual models + 1 for comparison (if > 1 model)
n_plots = len(plot_configs) + (1 if len(plot_configs) > 1 else 0)
if n_plots > 0:
fig, axes = plt.subplots(n_plots, 1, figsize=(16, 4 * n_plots), sharex=True)
if n_plots == 1:
axes = [axes]
split_idx = results["split_idx"]
test_subset = df.iloc[split_idx:].iloc[:TOTAL_FORECAST_INTERVALS]
# Helper function to get anomaly regions from test_subset
def get_anomaly_regions(test_df):
anom_mask = test_df["is_anomaly"] == 1
anom_indices = test_df.index[anom_mask].tolist()
if not anom_indices:
return []
regions = []
start = anom_indices[0]
end = anom_indices[0]
for idx in anom_indices[1:]:
if idx == end + 1:
end = idx
else:
regions.append((start, end))
start = idx
end = idx
regions.append((start, end))
return regions
anomaly_regions = get_anomaly_regions(test_subset)
# Plot each model
for plot_idx, (model_key, model_name, color, model_results) in enumerate(
plot_configs
):
ax = axes[plot_idx]
# Highlight anomaly regions with red background
for i, (start_idx, end_idx) in enumerate(anomaly_regions):
ax.axvspan(
test_subset.loc[start_idx, "timestamp"],
test_subset.loc[end_idx, "timestamp"],
color="red",
alpha=0.2,
label="True Anomaly" if i == 0 else None,
)
if model_key == "zscore":
# Z-score uses scores_df instead of forecast_df
zscore_df = model_results["scores_df"]
ax.plot(
zscore_df["timestamp"],
zscore_df["zscore"],
color,
linewidth=1.5,
label="Z-Score",
alpha=0.7,
)
ax.axhline(
y=2,
color="gray",
linestyle="--",
alpha=0.5,
label="Z=2 threshold",
)
ax.axhline(
y=3,
color="gray",
linestyle=":",
alpha=0.5,
label="Z=3 threshold",
)
ax.set_ylabel("Z-Score", fontsize=11)
else:
# Forecast-based models
forecast_df = model_results["forecast_df"]
ax.plot(
test_subset["timestamp"],
test_subset[TARGET_COL],
"k-",
linewidth=1.5,
label="Actual",
alpha=0.7,
)
ax.plot(
forecast_df["timestamp"],
forecast_df[TARGET_COL],
color,
linewidth=1.5,
label=model_name,
alpha=0.7,
)
ax.set_ylabel(
f"{TARGET_COL.replace('_', ' ').title()}", fontsize=11
)
ax.set_title(
f"{model_name} (AUROC: {model_results['metrics']['auroc']:.3f})",
fontsize=12,
fontweight="bold",
)
ax.legend(loc="upper right", fontsize=9)
ax.grid(True, alpha=0.3)
# Final plot: Anomaly Scores Comparison (normalized) if multiple models
if len(plot_configs) > 1:
ax = axes[-1]
# Highlight anomaly regions with red background
for i, (start_idx, end_idx) in enumerate(anomaly_regions):
ax.axvspan(
test_subset.loc[start_idx, "timestamp"],
test_subset.loc[end_idx, "timestamp"],
color="red",
alpha=0.2,
label="True Anomaly" if i == 0 else None,
)
for model_key, model_name, color, model_results in plot_configs:
errors = model_results["errors"]
norm_errors = (
errors / np.max(errors) if np.max(errors) > 0 else errors
)
if model_key == "zscore":
timestamps = model_results["scores_df"]["timestamp"]
else:
timestamps = model_results["forecast_df"]["timestamp"]
ax.plot(
timestamps,
norm_errors,
color,
linewidth=1.5,
label=model_name,
alpha=0.7,
)
ax.set_ylabel("Normalized Anomaly Score", fontsize=11)
ax.set_xlabel("Time", fontsize=12)
ax.set_title(
"Anomaly Scores Comparison (Normalized)",
fontsize=12,
fontweight="bold",
)
ax.legend(loc="upper right", fontsize=9)
ax.grid(True, alpha=0.3)
plt.tight_layout()
plt.savefig(
"usecases/anomaly_detection/anomaly_detection_results.png",
dpi=150,
bbox_inches="tight",
)
plt.show()
print("✅ Saved: usecases/anomaly_detection/anomaly_detection_results.png")
else:
print("⚠️ No models were run, skipping visualization.")
# %%
# ============================================================================
# Summary of Saved Files
# ============================================================================
print("\n" + "=" * 60)
print("SAVED FILES")
print("=" * 60)
print(
"1. usecases/anomaly_detection/multivariate_anomaly_visualization.png - Raw data with anomalies"
)
print(
"2. usecases/anomaly_detection/anomaly_detection_results.png - Detection results comparison"
)
print("\n🎉 Demo complete!")
# %%
Next Steps
- Experiment with metadata: Add or remove
METADATA_COLSto find the most predictive features - Apply to your data: Use your own multivariate time series with labeled anomalies
- Try with different thresholds: Adjust
ANOMALY_PERCENTILEorOPTIMIZE_METRICto balance precision and recall based on your use case