> ## Documentation Index
> Fetch the complete documentation index at: https://docs.synthefy.com/llms.txt
> Use this file to discover all available pages before exploring further.
# Explainability
> Explain Nori's predictions — SHAP / Shapley values, feature interactions, partial dependence, and feature selection.
Understand *why* Nori made a prediction: which features drove it, how they
interact, and how the model responds across a feature's range. Because
`NoriRegressor` is a scikit-learn estimator, it plugs directly into
[shapiq](https://github.com/mmschlk/shapiq) — a fast SHAP implementation with
native Shapley-interaction support — and the rest of the sklearn interpretability
ecosystem. The helpers in `synthefy_nori.interpretability` are thin convenience
wrappers, so you can also use the underlying tools directly.
[Runnable example](https://github.com/Synthefy/synthefy-nori/blob/main/examples/interpretability_regression.py)
## Install
```bash theme={null}
pip install "synthefy-nori[interpretability]" # pulls in shapiq
```
Nori is **regression-only**, so every method below explains the regression
predictive mean.
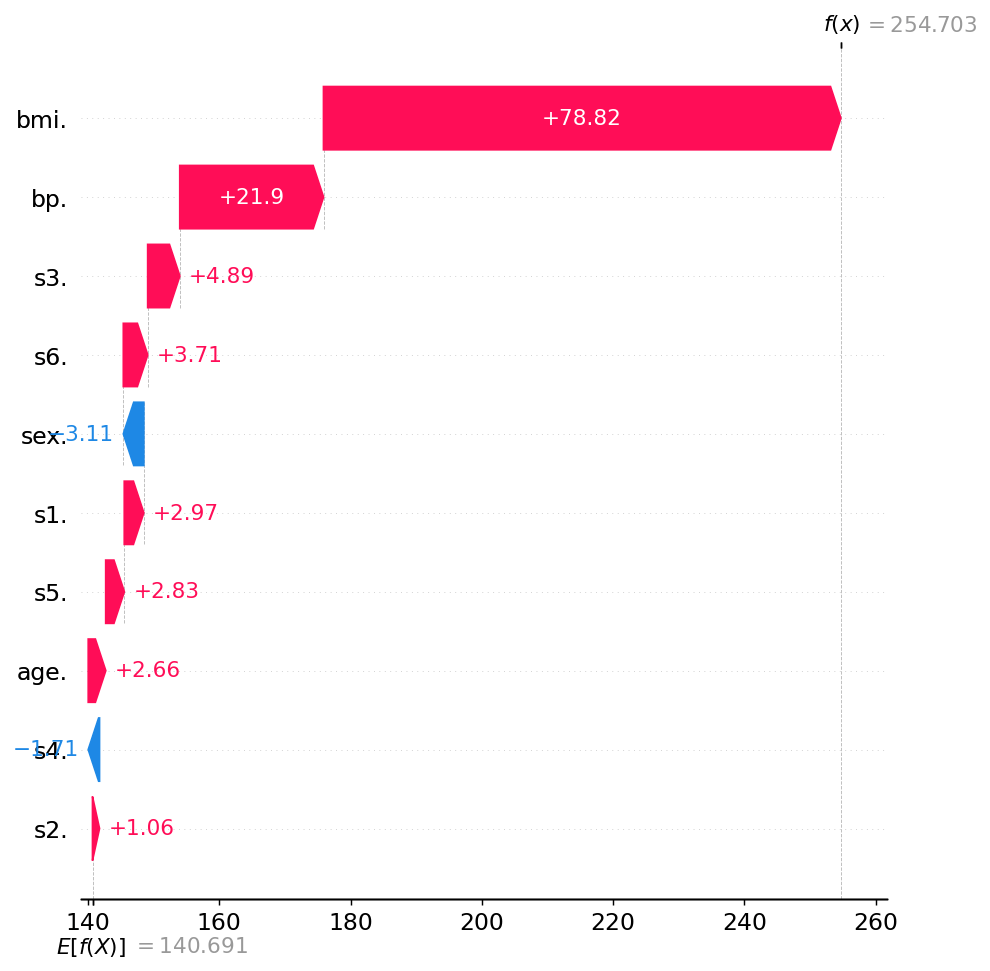
## SHAP / Shapley values & interactions
`get_nori_imputation_explainer` builds a `shapiq.TabularExplainer` that removes
features by **imputation** against a background set. The training context stays
fixed across coalitions, so each coalition is a single `predict` call — the cost
is set by `budget`.
```python theme={null}
from synthefy_nori import NoriRegressor
from synthefy_nori.interpretability.shapiq import get_nori_imputation_explainer
model = NoriRegressor(model="nori-30m").fit(X_train, y_train)
# index="k-SII", max_order=2 captures pairwise interactions;
# use index="SV", max_order=1 for plain Shapley values.
explainer = get_nori_imputation_explainer(model, X_train, index="k-SII", max_order=2)
sv = explainer.explain(X_test[:1], budget=128)
print(sv)
sv.plot_waterfall() # additive contribution waterfall
```
 Key parameters of `get_nori_imputation_explainer`:
* **`index`** — `"SV"` for plain Shapley values, or `"k-SII"` for k-Shapley
interactions (`max_order=1` reduces it to standard Shapley values).
* **`max_order`** — maximum interaction order (`1` = single-feature attributions,
`2` = pairwise interactions).
* **`imputer`** — `"baseline"` (one forward per coalition; recommended) or
`"marginal"` / `"conditional"` (multi-sample, much slower).
**Budget** trades accuracy for cost. Start at `128` and raise only if the
explanation looks noisy: `<10` features → 64–128; 10–20 → 128–512;
20+ → 512–2048.
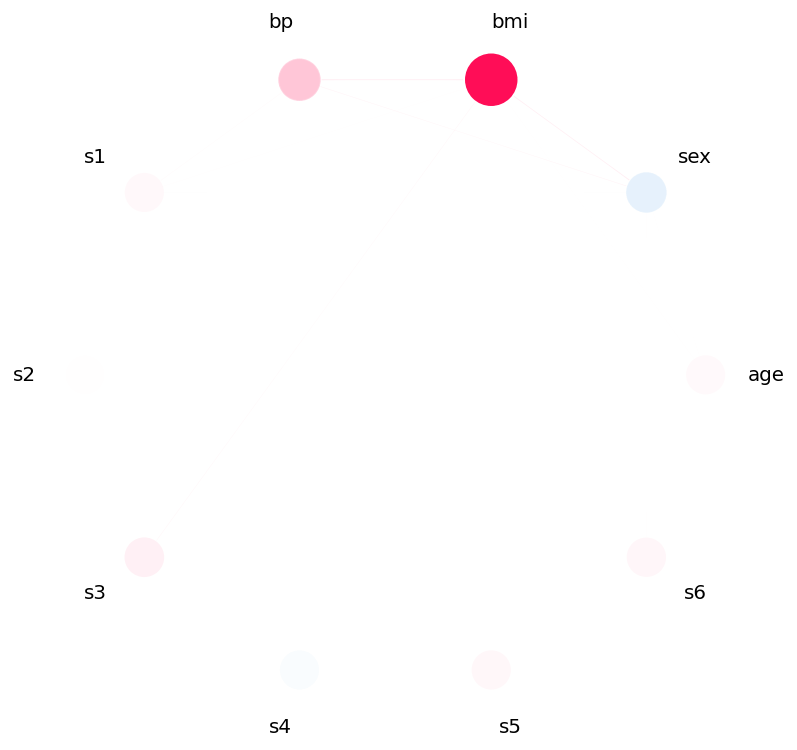
With `index="k-SII", max_order=2` the explainer also surfaces **pairwise
interactions**, which you can view as a network:
```python theme={null}
kv = explainer.explain(X_test[:1], budget=256)
kv.plot_network() # interaction graph
```
Key parameters of `get_nori_imputation_explainer`:
* **`index`** — `"SV"` for plain Shapley values, or `"k-SII"` for k-Shapley
interactions (`max_order=1` reduces it to standard Shapley values).
* **`max_order`** — maximum interaction order (`1` = single-feature attributions,
`2` = pairwise interactions).
* **`imputer`** — `"baseline"` (one forward per coalition; recommended) or
`"marginal"` / `"conditional"` (multi-sample, much slower).
**Budget** trades accuracy for cost. Start at `128` and raise only if the
explanation looks noisy: `<10` features → 64–128; 10–20 → 128–512;
20+ → 512–2048.
With `index="k-SII", max_order=2` the explainer also surfaces **pairwise
interactions**, which you can view as a network:
```python theme={null}
kv = explainer.explain(X_test[:1], budget=256)
kv.plot_network() # interaction graph
```
 ## Partial dependence / ICE
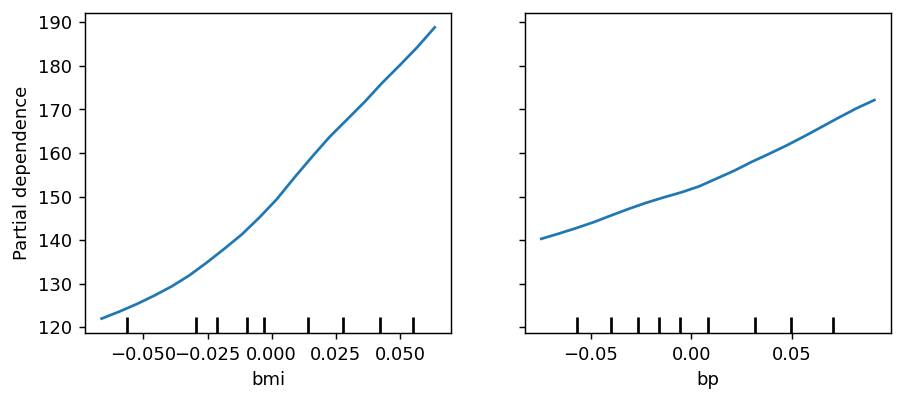
A global view of how the prediction shifts across a feature's range:
```python theme={null}
from synthefy_nori.interpretability.pdp import partial_dependence_plots
# 1-D effects for features 0 and 2; use kind="individual" or "both" for ICE.
partial_dependence_plots(model, X_test, features=[0, 2], kind="average")
```
Pass `(i, j)` tuples in `features` for 2-D interaction surfaces. Returns an
sklearn `PartialDependenceDisplay`.
## Partial dependence / ICE
A global view of how the prediction shifts across a feature's range:
```python theme={null}
from synthefy_nori.interpretability.pdp import partial_dependence_plots
# 1-D effects for features 0 and 2; use kind="individual" or "both" for ICE.
partial_dependence_plots(model, X_test, features=[0, 2], kind="average")
```
Pass `(i, j)` tuples in `features` for 2-D interaction surfaces. Returns an
sklearn `PartialDependenceDisplay`.
 ## Feature selection
Find a minimal feature subset that preserves cross-validated performance
(sequential selection):
```python theme={null}
from synthefy_nori.interpretability.feature_selection import feature_selection
res = feature_selection(model, X_train, y_train, n_features_to_select=5, cv=3)
print(res.selected_indices, res.selected_score_mean)
```
`n_features_to_select` accepts an int, a fraction, or `"auto"` (with `tol`). The
result also reports baseline-vs-selected CV scores.
Sequential selection re-fits Nori in-context on every CV split, so keep it to a
few thousand samples and a modest feature count.
## Notes
* These run on the **local Python package** (`synthefy-nori`), not the hosted API.
* TabPFN's fast Shapley path reuses a KV-cache across coalitions; Nori's public
package runs one forward per coalition — correct and budget-controlled, just
not cache-accelerated.
## Feature selection
Find a minimal feature subset that preserves cross-validated performance
(sequential selection):
```python theme={null}
from synthefy_nori.interpretability.feature_selection import feature_selection
res = feature_selection(model, X_train, y_train, n_features_to_select=5, cv=3)
print(res.selected_indices, res.selected_score_mean)
```
`n_features_to_select` accepts an int, a fraction, or `"auto"` (with `tol`). The
result also reports baseline-vs-selected CV scores.
Sequential selection re-fits Nori in-context on every CV split, so keep it to a
few thousand samples and a modest feature count.
## Notes
* These run on the **local Python package** (`synthefy-nori`), not the hosted API.
* TabPFN's fast Shapley path reuses a KV-cache across coalitions; Nori's public
package runs one forward per coalition — correct and budget-controlled, just
not cache-accelerated.